//1-VARIABLE FOR SALES DASHBOARD
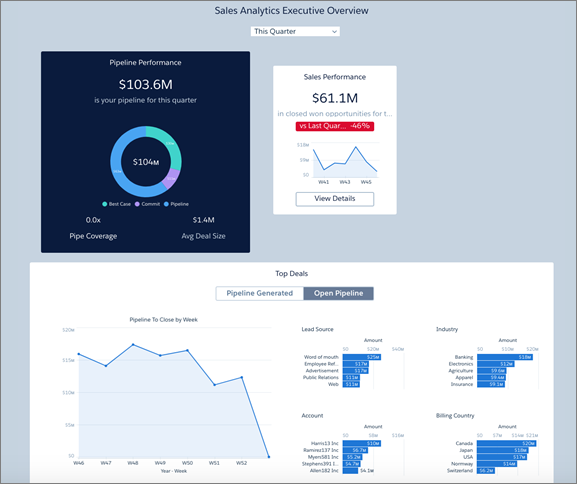
"Exec_Overview_Sales_Performance_backgroundColor": {
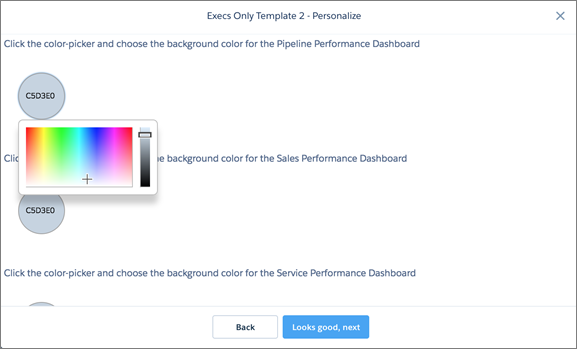
"label": "Click the color-picker and choose the background color for the Sales Performance dashboard",
"description": "",
"defaultValue": "#C5D3E0",
"variableType": {
"type": "StringType"
}
},
//1-VARIABLE FOR PIPELINE DASHBOARD
"Exec_Overview_Pipeline_Performance_backgroundColor": {
"label": "Click the color-picker and choose the background color for the Pipeline Performance dashboard",
"description": "",
"defaultValue": "#C5D3E0",
"variableType": {
"type": "StringType"
}
},
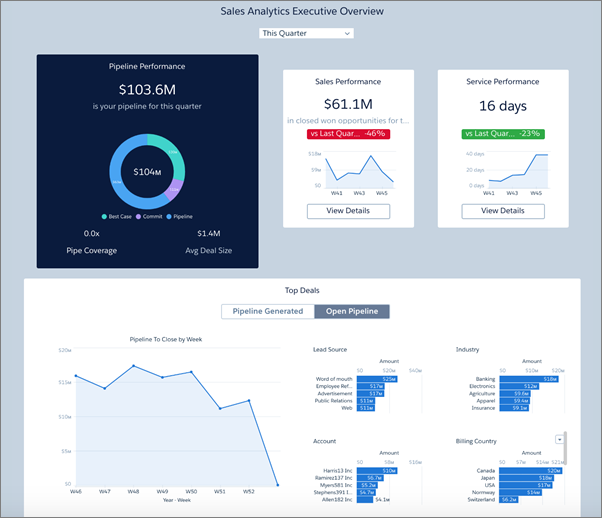
//3-VARIABLE FOR SERVICE DASHBOARD
"Exec_Overview_Service_Performance_backgroundColor": {
"label": "Click the color-picker and choose the background color for the Service Performance dashboard",
"description": "",
"defaultValue": "#C5D3E0",
"variableType": {
"type": "StringType"
}
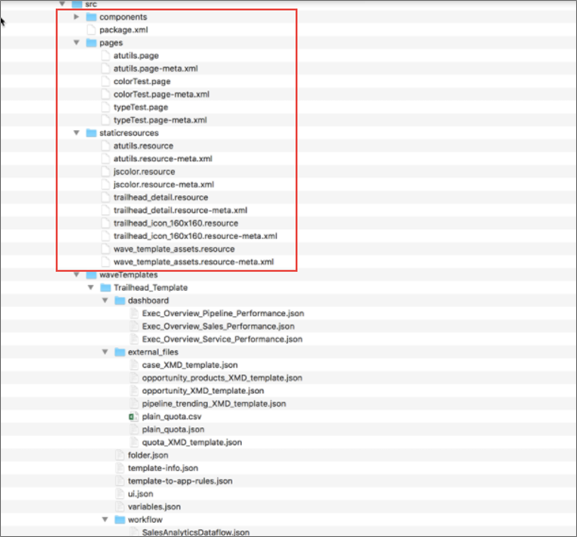
现在您已经看到了编辑Analytics Templates JSON文件的内容,您已准备好开始使用自己的模板。您首先需要一个应用程序,您可以从参考资料部分中引用的Salesforce Einstein Analytics帮助中了解所有相关信息。您还可以使用我们为本机创建的模板,您可以从参考资料部分的链接下载该模板。
"SObjectChoices": {
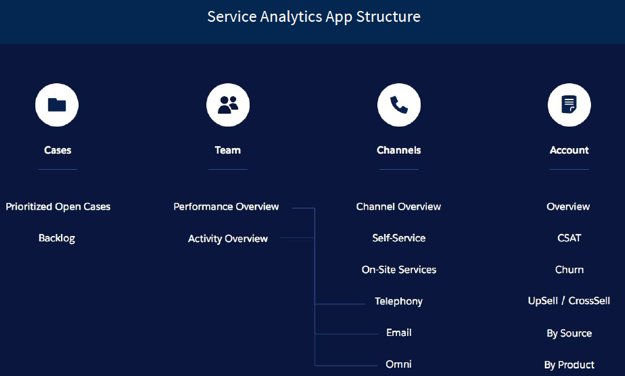
"label": "Choose additional objects to include in your app. Selecting Cases will add the Service Performance dashboard and a Cases dataset",
"description": "You can analyze data and build out additional dashboards using data from the additional object.",
"defaultValue": [],
"required": false,
"variableType": {
"type": "ArrayType",
"itemsType": {
"enums": [
"Cases"
],
"type": "StringType"
}
}
},
您可以在以下位置查看向导问题的文本: Choose additional objects to include in your app。你也可以看到“案例” 作为一个 枚举 下 “itemsType”。最后,这是来自的JSON ui.json 告诉向导显示反映新问题的问题 SObjectChoices 变量:
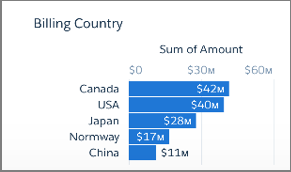
   //1-VARIABLE FOR GEOGRAPHIC DATA
  "Geography": {
    "label": "What field do you want to use to segment customers by geography?",
    "description": "Choose how Execs Only filters geographic data.",
    "defaultValue": {
      "sobjectName": "Account",
      "fieldName": "BillingCountry"
    },
    "required": true,
    "excludeSelected": true,
    "excludes": [
      "Name",
      "Industry"
    ],
    "variableType": {
      "type": "SobjectFieldType",
      "dataType": "xsd:string"
    }
  },
  //2-VARIABLE FOR SOURCES OF NEW BUSINESS
  "Source_L2": {
    "label": "What field do you want to use to segment sources for new business?",
    "description": "Choose how Execs Only filters data about new business sources.",
    "defaultValue": {
      "sobjectName": "Opportunity",
      "fieldName": "LeadSource"
    },
    "required": true,
    "excludeSelected": true,
    "excludes": [
      "Name",
      "StageName",
      "ForecastCategory",
      "ForecastCategoryName"
    ],
    "variableType": {
      "type": "SobjectFieldType",
      "dataType": "xsd:string"
    }
  },
  //3-ORIGINAL VARIABLE FROM PREVIOUS VERSION OF FILE
  "Overrides": {
    "required": true,
    "description": "Internal configuration to allow asset creation overrides, not to be displayed in UI.",
    "defaultValue": {
      "createAllDashboards": false
    },
    "variableType": {
      "type": "ObjectType",
      "properties": {
        "createAllDashboards": {
          "type": "BooleanType"
        }
      },
      "strictValidation": true
    }
  },
  "pages": [
    {
      "title": "Create Execs Only App",
      "variables": [
        { "name": "Geography" }, //QUESTION ABOUT GEOGRAPHIC DATA
        { "name": "Source_L2" }, //QUESTION ABOUT SOURCES OF NEW BUSINESS
        { "name": "SObjectChoices" } //QUESTION ABOUT ADDING CASES DATA
      ]
    }
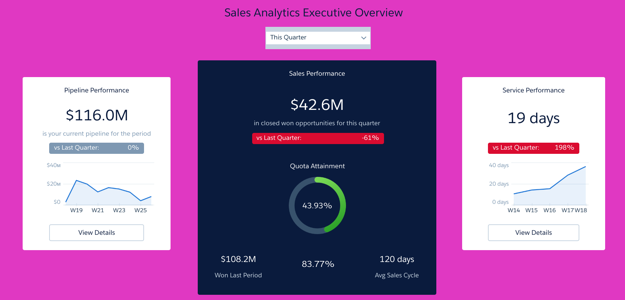
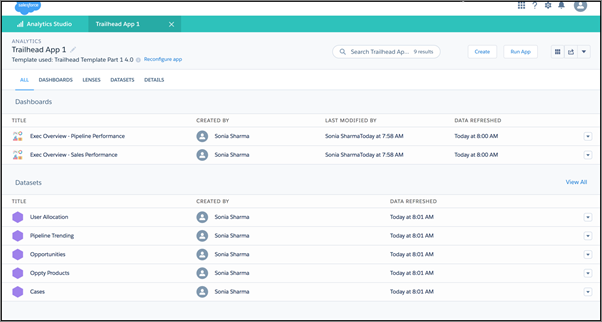
你刚刚创建了自己的应用 恭喜!您可以查看应用仪表板的所有基本部分,但其中一些可能缺少数据。如果您想在正确的位置查看所有数据,可以运行Trailhead Data Manager。这是完成徽章的可选项,但您的仪表板看起来要好得多。在“现实世界”中,当您使用自己的许可证创建应用程序时,您永远不必这样做。我们邀请您在不考虑太多的情况下进行冲击。
重要
在运行Trailhead Data Manager之前,请确保您可以看到应用程序的仪表板。请记住,您只需要在Trailhead中运行数据管理器。您不必使用它来在您自己的组织中设置应用程序。
该过程的第一部分包括刷新数据,然后运行应用程序的数据流。
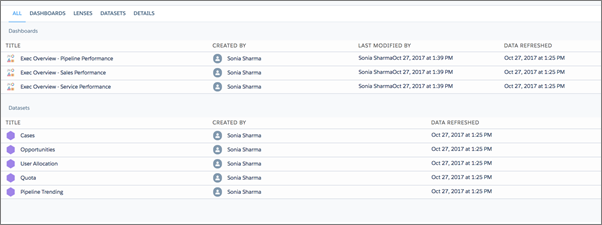
在Analytics Studio中,转到右上角的应用程序选择器,然后选择 Trailhead Data Manager。您可能需要向下滚动才能找到它。
选择Items下面的Trailhead Data Manager链接。
在Trailhead Data Manager主页上,选择Trailhead Data Manager。
在下一页上,单击“ 刷新DTC数据”。
现在运行app数据流。从应用程序选择器中选择它,返回到Analytics Studio。
单击右上角的齿轮图标,然后选择“ 数据管理器”。(您将打开Analytics Data Manager,不要与Trailhead Data Manager混淆。)从左上角的菜单中,选择Dataflow View。
接下来,您下载并导入名为Quota的CSV文件,以便在您的应用中显示有关配额的数据。您还可以使用Trailhead Data Manager来执行此操作。注意在现实生活中,如果您将配额数据存储在Salesforce外部的工具中并希望在Analytics中查看数据,则只需向应用添加配额数据。对于Sales Analytics应用程序客户,有时会出现这种情况。